In micro-fluid devices, the thermoplastic material consumption is tremendously increased compared to silicon or glass. Known in literature as the main material in the production of bio-reactor, Polidimentilsilicsan (PDMS) has disadvantages such as low endurance, sensitivity respect to chemicals, and permeability to the water stream. Yet, some thermoplastic materials such as COP, PMMA, and PS are more long-lasting and less expensive. In this project, It is aimed to produce a micro-fluid device (nano bio-reactor) by using COP, PMMA, and PS materials. In the production process, photolithography, grinding, warm roughening, and hot compressing procedures are followed. The suitability of yeast production within Lab-on-a-chip (LOC) devices made by these different materials is investigated based on the advantages of COP, PS, and PMMA are offered. The best-resulted material is used in the investigation of the effects of aeration on the protein expression of fluorescent-tagged yeast cells. After the ensued experiment on the LOC devices, COP material is responded the best as among others by having the least autofluorescent expression and the biggest growth in yeast cells. Correspondingly, the protein expression of fluorescent-tagged yeast cells is expecting to decrease due to the scarcity of aeration; after a while, it is increasing as it is expected. Outcomes of this research promise to uncover new aspects of the design of bio-reactors and micro-aeration at the nanoscale.
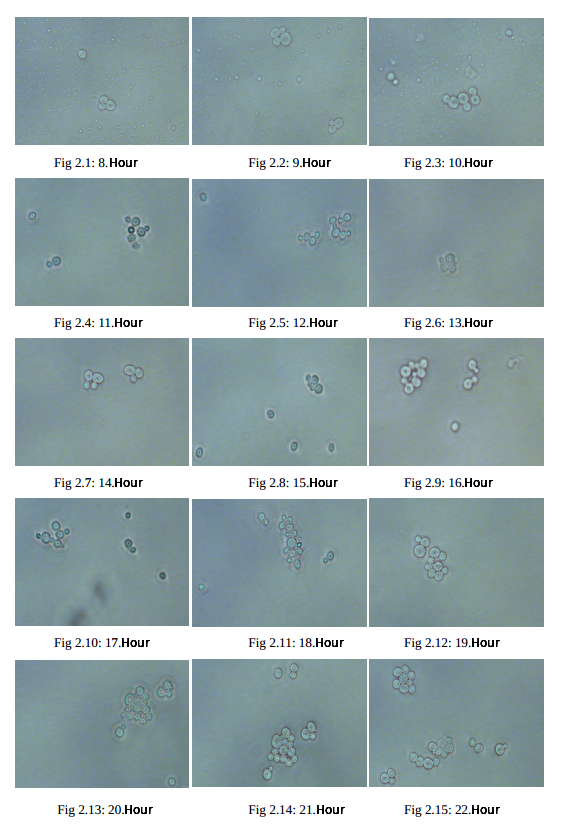
The level of cellular fluorescence from fluorescence microscopy images is determined in the ImageJ program. Cellular area, mean grey value, integrated density, and perimeter of the cell are measured by meticulous selection in each microscopy images. In addition, the same selection is repeated for the no fluoresce (background area) for the calculation of corrected total cell fluorescence.
P.S. The size of the background area is not important, 2 selections from around the cell are taken for accuracy.
Corrected total cell fluorescence (CTCF) is calculated based on the following formula:
CTCF = Integrated Density – (Area of selected cell X Mean fluorescence of background readings)
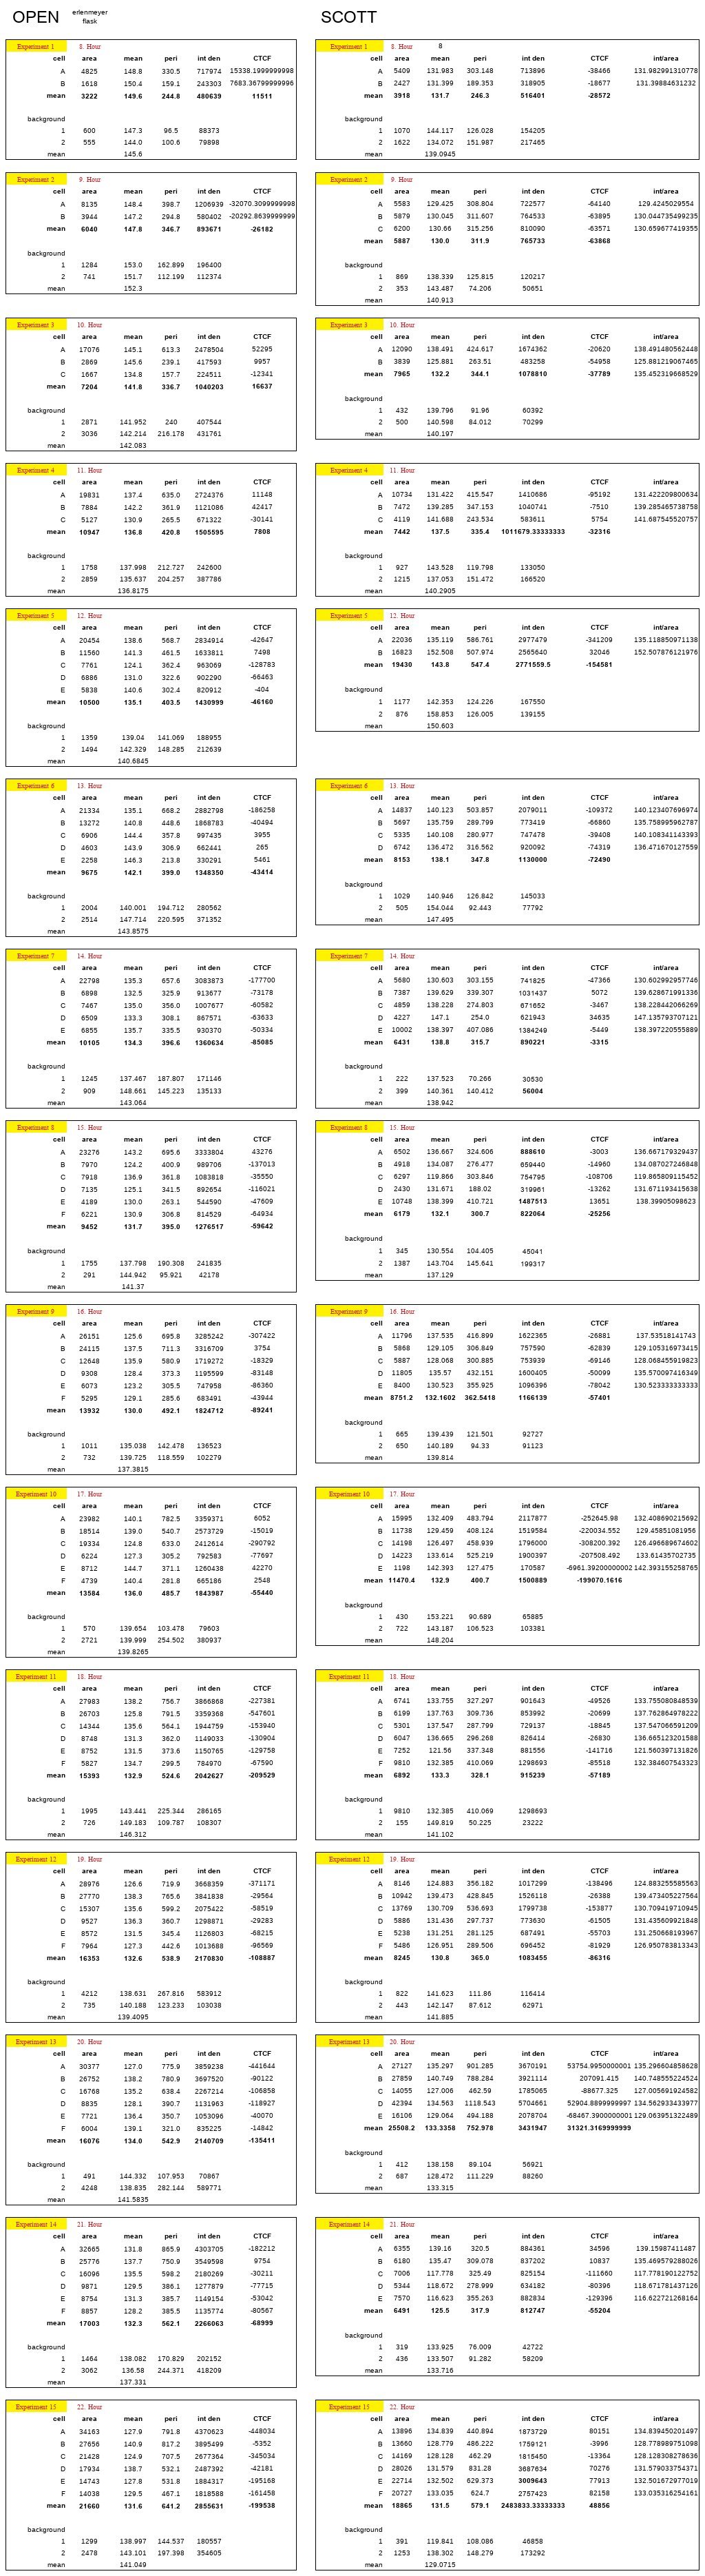
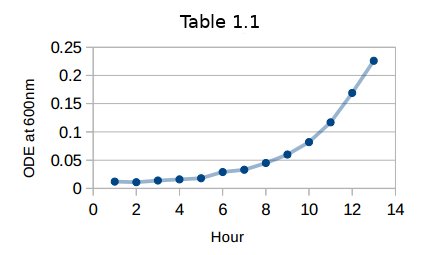
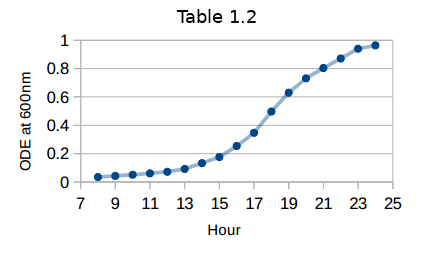
Mainly, two different analysis is made in order to examine the effects of aeration. First, the Erlenmyaer flasks are used for the experiment. Then, Scott bottles are used for isolation.
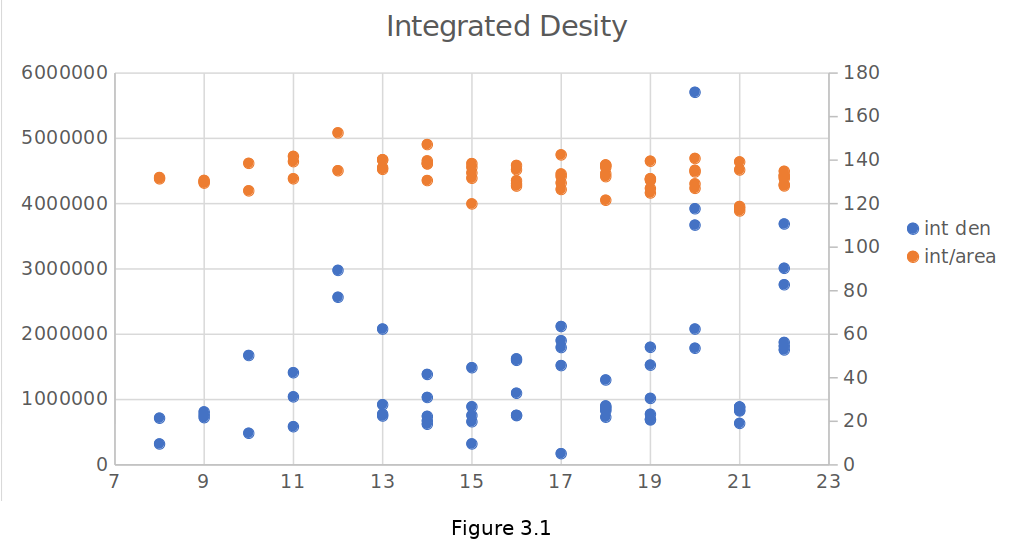
To see the accuracy of the data integrated density versus integrated density divided by area is shown in Figure 3.1
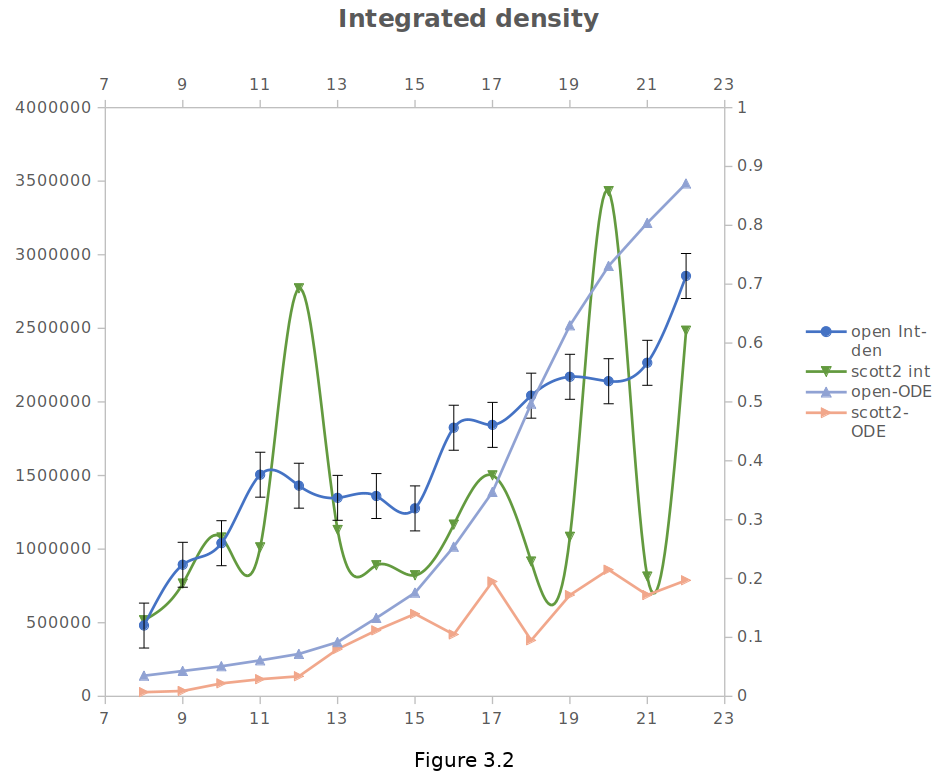
Moreover, to observe the actual pattern of growth in cells, both ODE and integrated density curvatures are shown in Figure 3.2
Data is proved that the protein expression of fluorescent-tagged yeast cells is decreasing due to the scarcity of aeration; after a while, it is increasing with somewhat a minor error.